Robertson chart in glacial till
Why the CPT classifies overconsolidated glacial till as sand – and why every group of CPTs therefore has a borehole alongside.
At a glance
- Purpose
- Interpret the soil behaviour type from the CPT correctly where the ground moraine is glacially preloaded.
- Input
- qc and fs per centimetre; borehole log of a key borehole; water level for the effective stress.
- Output
- Robertson zone as behaviour type, not as soil type; a flag wherever CPT and borehole disagree.
- Limitations
- From qc and fs alone, glacial till cannot be reliably distinguished from dense sand. Without u2 measurement, qt ≈ qc.
- Standards
- DIN EN ISO 22476-1, DIN EN ISO 14688-1, DIN 18196
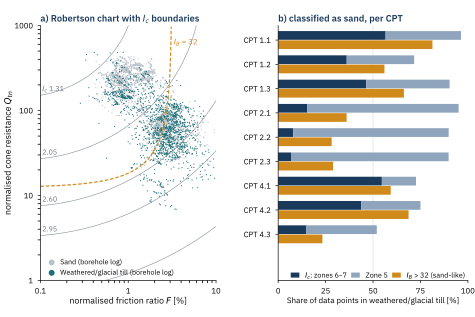
01Findings at approx. 5 300 data points in weathered till and till
02Why this happens
The CPT responds to the mechanical behaviour in the ground, not to the grain size distribution [1]. Very stiff, heavily overconsolidated fine-grained soils behave like coarse-grained soils and dilate on shearing [1]. For these, the chart provides zones 8 and 9, “overconsolidated or cemented” [1]; the Ic circles of zones 2 to 7 do not capture them. At low overburden, normalisation also raises Qtn. IB [2] separates only partly as well: the till plots where dense silty sand also plots.
03How we evaluate
- Key borehole per site: it shows what is in the ground; the CPT provides depth, variability and strength [3].
- Zone as behaviour type, never as soil type; always both Ic and IB.
- House rule: zone 6–7 with qc above 30 MPa where the borehole shows ground moraine → flag “sand or preloaded till – compare with borehole”.
- Parameters within their range of validity: no relative density in till, cu there as an upper estimate.
Ic after Robertson & Wride [4], IB and CD after Robertson [2]; Qtn normalised cone resistance, F normalised friction ratio [%]. Without u2 measurement, qt ≈ qc; σ′v0 = σv0, as no free groundwater was encountered down to final depth. Five CPTs refused at 34 to 46 MPa before target depth – possibly on cobbles, but unconfirmed.
- Robertson, P. K. (2010) Soil behaviour type from the CPT: an update. 2nd Int. Symp. on Cone Penetration Testing (CPT’10), Huntington Beach; cpt-robertson.com, accessed 24 Sept. 2026
- Robertson, P. K. (2016) Cone penetration test (CPT)-based soil behaviour type (SBT) classification system – an update. Canadian Geotechnical Journal 53, 1910–1927
- GeoStudys Method sheet 01 (2026) Layer boundaries with confidence level · DIN EN ISO 22476-1:2023-04 · DIN EN ISO 14688-1:2020-11 · DIN 18196:2023-02
- Robertson, P. K.; Wride, C. E. (1998) Evaluating cyclic liquefaction potential using the cone penetration test. Canadian Geotechnical Journal 35(3), 442–459
SUGGESTED CITATION: GeoStudys Consulting (2026): Robertson chart in glacial till. GeoStudys Method sheets, Sheet M03. www.geostudys.com/en/technical-articles/robertson-chart-glacial-till.html